
The S&P 500 gained 1.7% last week, alternating between up and down days. The index is still a little more than 2% of all-time highs in the spooky month of October (more on that below). We wouldn’t be surprised to see more volatility, but we still think the environment is supportive. With fiscal stimulus in play, the Fed cutting rates, the AI boom not likely to let up soon, and earnings growth continuing to look good, we think there’s more than enough going on to overcome the risk from tariffs and a slowing job market.
More impressive than the S&P 500, gold extended its recent run last week. The Bloomberg Gold Index picked up 5.4% and is up 57.8% for the year. If the year ended now, that would be the best year for the yellow metal since 1979. We’ve had a tactical allocation to gold since March 2023, but we mostly added it as a diversifier. While we thought a rise in demand was entirely possible, we did not see these kinds of gains coming (but we won’t complain). Today we also take a closer look at what could derail this historic run.
Remembering the 1987 Crash
If everybody is thinking alike, then somebody isn’t thinking.
—General George S. Patton
Well, that October volatility and spookiness is happening. But to be honest, we aren’t surprised. Yes, worries over trade with China, regional banks, and private credit are taking “credit” for the recent weakness. But the truth is after a historic six-month rally and with the usually volatile month of October upon us, we are welcoming this volatility and potential weakness as an opportunity before a likely strong end-of-year rally.
Three Years Ago Today
We’ve talked a lot about this bull market turning three years old, but today marks one of our all-time favorite contrarian indicators.
Three years ago today, Bloomberg’s recession probability model was telling us there was a 100% chance of a recession (so much for models). The editors at Bloomberg were so excited about it that they made it the headline in an article, and our contrarian warning bells began to ring. They weren’t the only ones. A Bankrate survey at the time had 86% of economists saying a recession was more likely than not. Everywhere we looked, investors and economists alike were proclaiming how much worse things would get. Stocks were down 25%, the yield curve was inverted, manufacturing was in shambles, inflation was soaring, the Federal Reserve was hiking at a pace rarely seen in history, and even bonds (usually a safe haven when stocks do poorly) were getting crushed.
Yet, like the quote from General Patton above, for the very few who looked a little deeper, it became clear that not everyone was thinking, as stocks were bottoming and the vicious bear market of 2022 was over.
If you are reading this, then you are probably aware we were one of the very few places out there in October 2022 saying things were going to turn around and we would avoid a recession. We were mocked nearly daily for this call. Our own Chief Market Strategist Ryan Detrick was literally laughed at ON LIVE TV for saying the bear market was nearly over.
Going against the crowd is hard, and in a public forum like we are in, it can be merciless. But we followed our process, stuck to our guns, and are broadly happy with the decisions we made in those dark days. You are only as good as what you’ve done lately, but we continue to see solid times ahead.
Now on to some timeless memories from 1987.
Remember The Crash of 1987
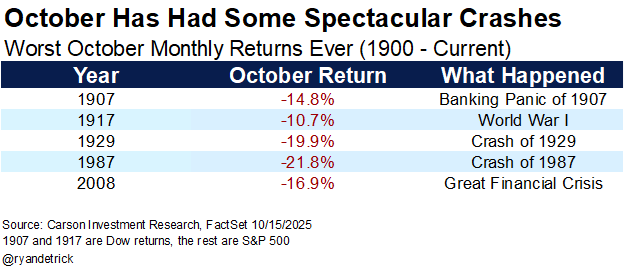
October is known for many things, with incredible market crashes likely at the top of the list. The crashes of 1929 and 1987 stand out for many investors, and who could forget the selling and volatility of October 2008? Going back further, we also saw spectacular crashes in 1907 and 1917.
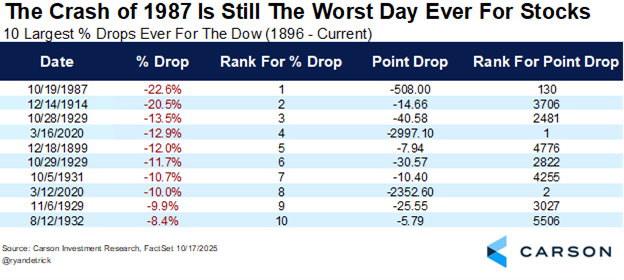
In honor of the greatest drop in stock market history, we’ll take a closer look at the crash of 1987. On Monday, October 19, 1987, the Dow fell 22.6% for the largest one-day drop in the more than 129-year history of the Dow. To this day, it is still the largest percentage drop ever, but it now ranks as only the 130th largest point decline.
What caused it? The funny thing is that 38 years later there’s still no consensus, but here are some things to know about the Crash of 1987:
- For starters, stocks were in the midst of a huge run off the August 1982 lows, with the Dow up more than 40% for the year in early August 1987, amounting to one stretched rubber band.
- Then consider Alan Greenspan took over the Federal Reserve Bank in August and to cool things off, was hiking rates. Talk about a bad time to start a new job.
- Program trading was blamed as well. The Friday night before the crash, Louis Rukeyser was pointing out issues with program trading. (Simply put, program trading automatically sold stocks if certain levels were hit. It worked fine until stocks began to fall more than ever expected, leading to even more automated selling as prices dropped.)
- Currency markets were on edge as well, as the U.S. wanted Germany to weaken their currency due to the latest trade deficit numbers. The back and forth was all over the media, as recently as the Sunday before the crash.
- The selling started earlier actually, as the three days before the crash, the Dow was down 3.8%, 2.4%, and 4.6%, making it safe to say investors were on edge all weekend for how things might open on Monday morning.
In the end, the Dow fell a then record 508 points for a 22.6% one-day decline, topping the previous largest one-day decline of 20.5% in December 1914, when the Dow began trading after being halted for nearly five months due to World War I.
Something most investors might not know is that stocks still finished the year in the green in 1987. Sure, they were well off their highs, and the huge volatility was too much for many investors to handle. But if all you saw was the yearly gain of 2% in 1987, you’d think it was a boring year!
In the end, volatility, as always, was the price of admission for investing for the long run. It is just part of the process—the bigger risk for investors is not volatility itself but failing to recognize that it’s going to happen and it’s normal. Just always remember that the Dow started trading on May 26, 1896, and it has seen wars, famines, pandemics, inflation, deflation, booms and busts, and more. Yet, it has always eventually come back to new highs. And whenever we have the next bear market, we don’t think this longer-term pattern of eventual new highs will change.
Why Is Gold Surging?
Gold has been surging this year and is in the middle of a strong multiyear run. 2025 to date is the metal’s second-best year since 1975—surpassed only by 1979’s 127% surge—and it follows strong gains in 2023 (+13%) and 2024 (+27%). We first added gold to our portfolios in March 2023 as a hedge that didn’t behave like long-term Treasuries. With inflation stubborn and the Fed still tightening, it provided potential upside from falling real rates (rates with inflation removed) if growth rolled over. Gold was flat through most of 2023 before rallying sharply in Q4 2023, consolidating mid-2025, and then going parabolic in late summer.
Momentum Meets Central Bank Buying?
The simplest explanation is momentum—strength feeding on itself. But momentum needs a starting point, and another major factor is central bank demand. The ECB noted this June that official purchases accounted for over 20% of global gold demand in 2024, double the 2010s average. Much of it came after Russia’s 2022 invasion of Ukraine, when the U.S. froze Russian reserves. Many emerging-market central banks diversified into gold afterward to reduce exposure to the dollar-centric system.
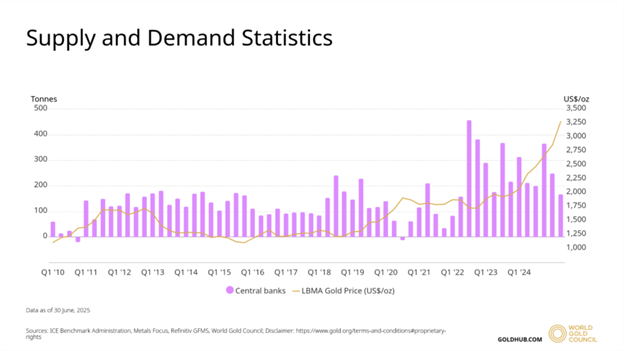
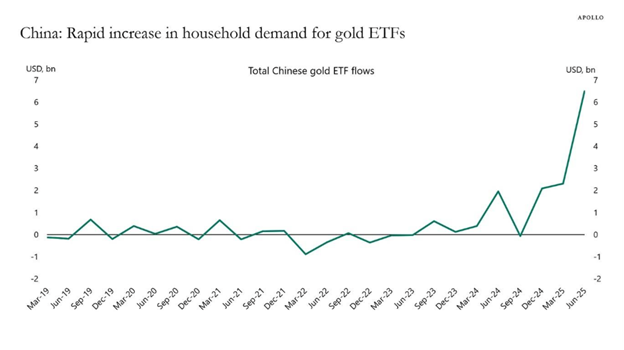
Still, central bank buying alone doesn’t explain this year’s surge. Buying began in 2022 and slowed in early 2025 even as prices climbed. A better clue lies in Asian household demand, especially in China. With property markets collapsing, Chinese investors have shifted savings into physical gold and funds that own gold or provide exposure to gold prices, while India’s seasonal wedding demand remains steady (though India’s affinity for gold is not uncommon knowledge).
The “Debasement” Trade
Some have described gold as benefiting from the “debasement” trade. The idea is that investors are now more worried about protecting purchasing power than debt deflation and downside protection. This is an environment that could favor alternative “real assets” like gold, real estate, bitcoin, and even stocks.
There has been some push back against this idea, which generally runs in the form of…
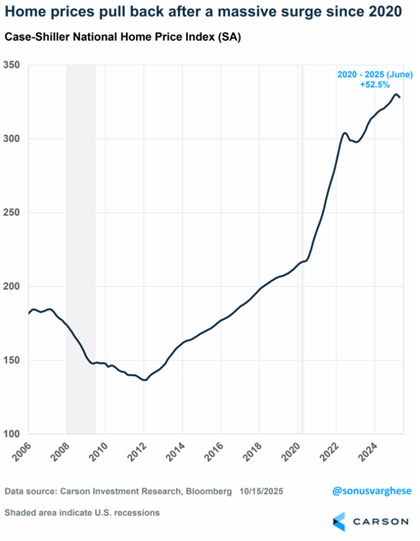
- Real estate prices aren’t rising, especially home prices.
- Bonds have done well this year, with short and long-term yields falling, not what you’d expect under “debasement.”
The critique that “real assets aren’t rising” overlooks that U.S. home prices remain 26% higher than in mid-2021 and over 50% above pre-COVID levels.
Bonds, meanwhile, have rallied as yields fell this year:
- 1-year = 3.61% (-53 bps, 1 bps = 0.01%)
- 2-year = 3.49% (-75 bps)
- 5-year = 3.61% (-78 bps)
- 10-year = 4.02% (-55 bps)
Lower yields reflect soft labor markets and recession fears, not necessarily confidence in currency stability. Our House View portfolios remain overweight equities but use gold and bonds as complementary diversifiers—gold for crises, bonds for recession risk.
Falling Policy Rate Expectations Are Driving Yields Lower
To a first approximation, Treasury rates are what the market expects short-term policy rates to be in the future. Markets have dramatically repriced the Fed’s path. Expected policy rates for 2025-26 have dropped more than 100 bps since January, with investors now seeing:
- 2 more cuts in 2025 (to 3.6%)
- 3 cuts in 2026 (taking policy rates below 3.0%)
- Gradual hikes only from 2028
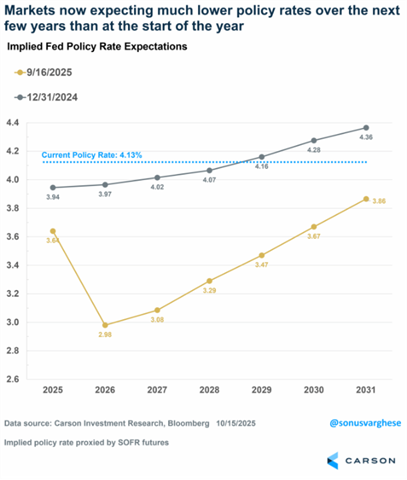
Even far-dated 2031 expectations have fallen 50 bps, keeping long yields anchored. The 10-year Treasury yield has tracked that decline, signaling markets expect an extended period of low real rates (a tailwind for gold). Interestingly, Fed members expect the long-term “neutral” rate to be 3%, but markets are pricing rates well above that.
![]()
Here’s another way to look at what’s happening with yields. As noted above, long rates are essentially future expectations of short-term rates. But if you take the 10-year or 30-year yield, it’s actually the average expected yield over the next 10 or 30 years. So knowing that it went up is not very useful, as it doesn’t tell you whether long-term rates went up because near-term rate expectations rose, or long-term expectations rose, or both.
We can decompose yields into short-term yields and future expectations of short-term yields. There is a “term premium” too, but this is a reasonable approximation. The 30-year yield can be decomposed into:
- The 2-year yield, reflecting near-term expectations for Fed policy.
- The 8-year yield expected after the first 2 years, i.e. 2-year/8-year, reflecting growth expectations from year three to year eight.
- The 20-year yield expected 10 years from now, i.e. 10-year/20-year.
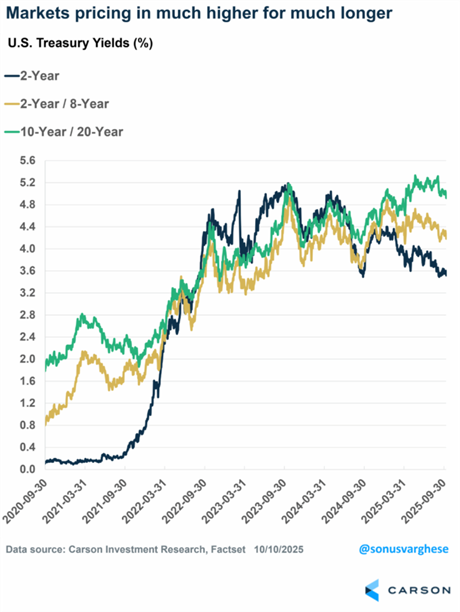
As you can see in the chart below:
- The 2-year yield has plunged over 70 bps as investors price in cuts.
- Medium-term yields (2-year/8-year) remain elevated, but they’ve softened recently, reflecting a Fed that’s going to keep rates on the lower side even beyond 2026-2027.
- The long-end (10-year/20-year) remains stubbornly high near 5%, implying that inflation concerns persist even as growth slows.
Inflation Expectations Remain Tame, Despite Uncertainty
Market-based inflation expectations appear tame, or “well anchored,” as the Fed likes to say. One-year inflation swaps hover around 3.1%, inflated by tariff effects, while the nine-year-ahead average excluding this year sits near 2.4% (1-year/9-year)—roughly in line with the Fed’s target when adjusted for the gap between CPI inflation, which is reflected in this data, and PCE inflation, which is the Fed’s preferred measure. That gap is usually about 30 – 40 bps, so an expectation of 2.4% for CPI is roughly in line with the Fed’s long-term target of 2% for PCE.
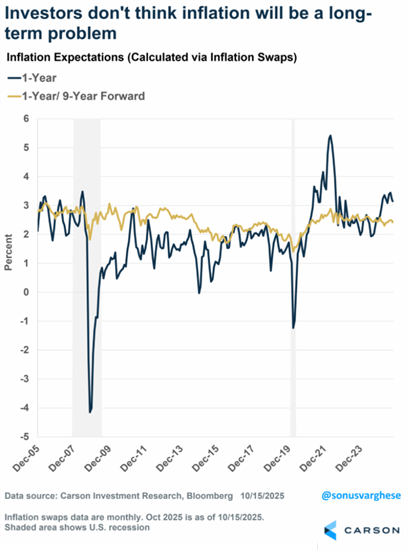
Survey data is less settled. The University of Michigan survey shows widening partisan splits. Even independents are still expecting 3.7% inflation over five years—higher than in mid-2022 when inflation peaked. The New York Fed survey is milder, with one-year expectations at 3.4% and three-year at 3.1%, not too far above what we saw in 2015-2018.
Taken together, inflation expectations are stable. But there’s still a lot of uncertainty, and we don’t think these expectations reflect tail risks. Inflation remains above target, but there are opposing forces on inflation: shelter costs are easing while food and electricity stay high. Rate cuts could spark a mild re-inflationary boom, especially if tariffs and reshoring persist. Deglobalization and geopolitical frictions—U.S.-China tensions, tariff wars—add chronic cost pressure, and goods inflation may not be “transitory.” We’re not saying inflation is going to surge; rather that it’s a very messy outlook.
What’s The “Message of the Market” From Gold?
If official inflation gauges look contained, what is gold signaling? Possibly that investors distrust them. Gold may be front-running a period of low real yields—either from easier Fed policy or from fiscal and political constraints that discourage tightening.
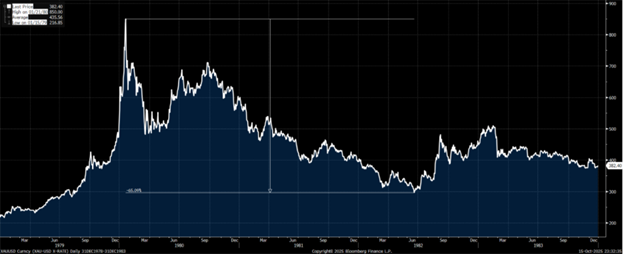
One interesting counter-factual here is to think about what could cause gold prices to get crushed and stay down?
History provides a key case: in 1980-81, Paul Volcker crushed inflation by pushing rates to near 20%. Not only did he push the economy into a recession, but gold prices fell 33% in 1981 and saw a 65% drawdown from peak levels in January 1980 to the bottom in June 1982.
Today’s Fed is doing the opposite. At Jackson Hole on August 22, 2025, Powell emphasized prioritizing jobs over inflation—a dovish tilt reinforced in subsequent meetings. Not coincidentally, gold’s latest leg higher began that week.
As mentioned above, the inflation outlook is messy. In such an environment, the Fed’s shift toward labor-market protection implies structurally lower real rates, a key tailwind for gold. Momentum, central-bank diversification, Asian household demand, and debasement fears all reinforce the rally, but the unifying thread is that real yields are falling while trust in currency stability erodes.
What Could End the Rally?
A sharp policy reversal—an explicit Volcker-style tightening—would crush gold. Absent that, the setup remains favorable. With global growth uneven, the Fed dovish, and fiscal deficits entrenched, the opportunity cost of holding gold seems minimal to us.
In other words, gold’s rise is less about imminent inflation than about a loss of confidence in nominal anchors—currencies, central banks, and policy discipline. Unless those anchors are restored, investors may continue to treat gold not just as a crisis hedge but as a complement to currency as a store of value in a world of perpetual stimulus and strategic uncertainty.
This newsletter was written and produced by CWM, LLC. Content in this material is for general information only and not intended to provide specific advice or recommendations for any individual. All performance referenced is historical and is no guarantee of future results. All indices are unmanaged and may not be invested into directly. The views stated in this letter are not necessarily the opinion of any other named entity and should not be construed directly or indirectly as an offer to buy or sell any securities mentioned herein. Due to volatility within the markets mentioned, opinions are subject to change without notice. Information is based on sources believed to be reliable; however, their accuracy or completeness cannot be guaranteed. Past performance does not guarantee future results.
S&P 500 – A capitalization-weighted index of 500 stocks designed to measure performance of the broad domestic economy through changes in the aggregate market value of 500 stocks representing all major industries.
The NASDAQ 100 Index is a stock index of the 100 largest companies by market capitalization traded on NASDAQ Stock Market. The NASDAQ 100 Index includes publicly traded companies from most sectors in the global economy, the major exception being financial services.
The views stated in this letter are not necessarily the opinion of Cetera Wealth Services LLC and should not be construed directly or indirectly as an offer to buy or sell any securities mentioned herein. Investors cannot invest directly in indexes. The performance of any index is not indicative of the performance of any investment and does not take into account the effects of inflation and the fees and expenses associated with investing.
A diversified portfolio does not assure a profit or protect against loss in a declining market.
Compliance Case #8491723-101325_C
